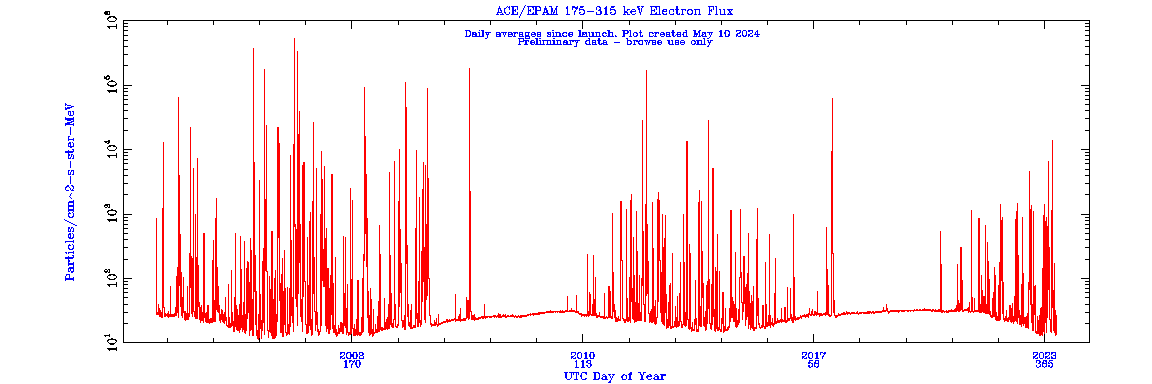
    Protons (H):
          1 hr    daily    Averages

    Ions :
          1 hr    daily    Averages

    Electrons :
          1 hr    daily    Averages
![]()
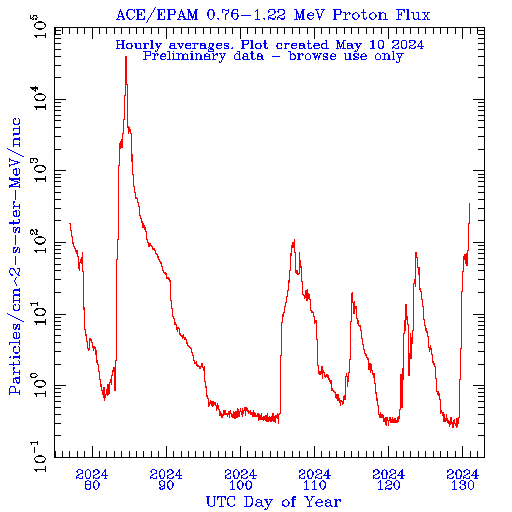
![]() Protons (H) :
1 hr Average
go to daily Avg.
Protons (H) :
1 hr Average
go to daily Avg.
![]()
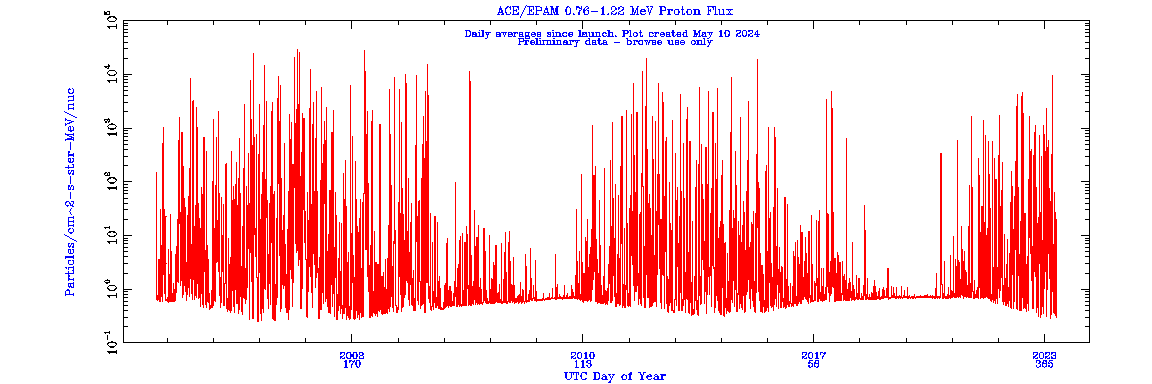
![]() Protons (H) :
daily Average
go to 1 hr Avg.
Protons (H) :
daily Average
go to 1 hr Avg.
![]()
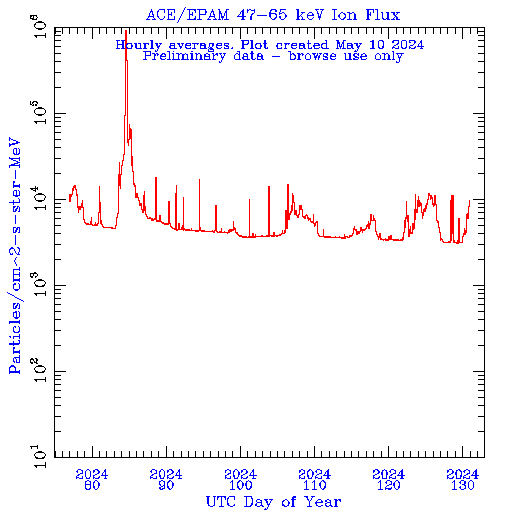
![]() Ion, very lo :
1 hr Average
go to daily Avg.
Ion, very lo :
1 hr Average
go to daily Avg.
![]()
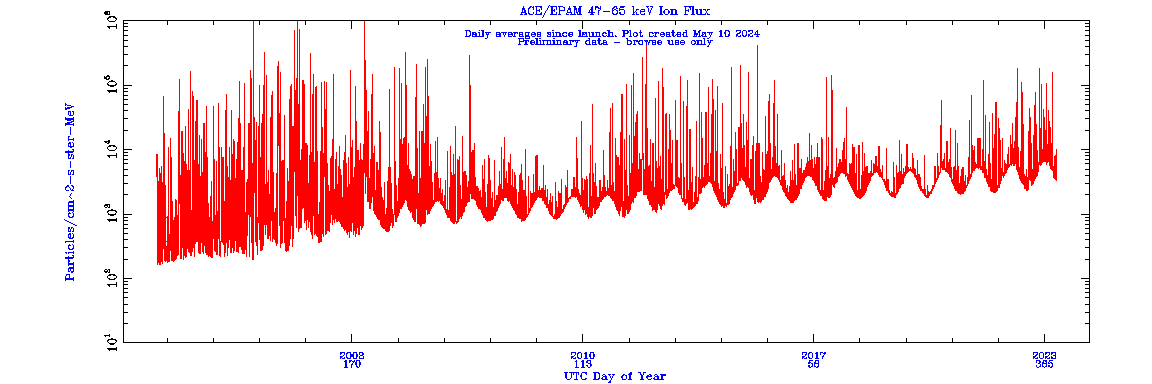
![]() Ion, very lo :
daily Average
go to 1 hr Avg.
Ion, very lo :
daily Average
go to 1 hr Avg.
![]()
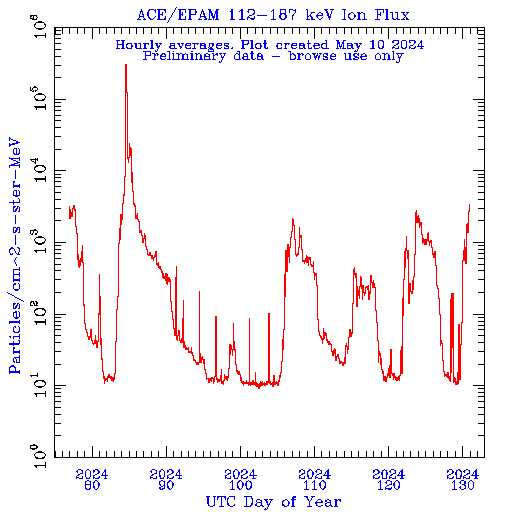
![]() Ion, lo :
1 hr Average
go to daily Avg.
Ion, lo :
1 hr Average
go to daily Avg.
![]()
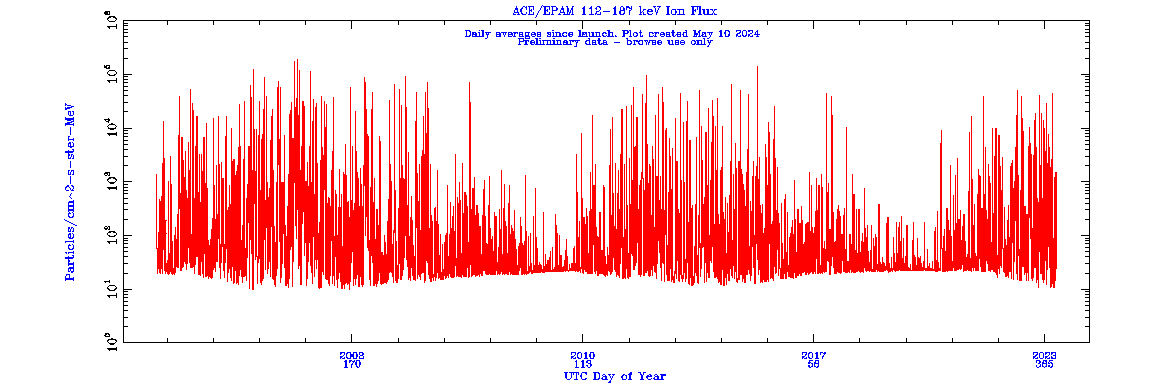
![]() Ion, lo :
daily Average
go to 1 hr Avg.
Ion, lo :
daily Average
go to 1 hr Avg.
![]()
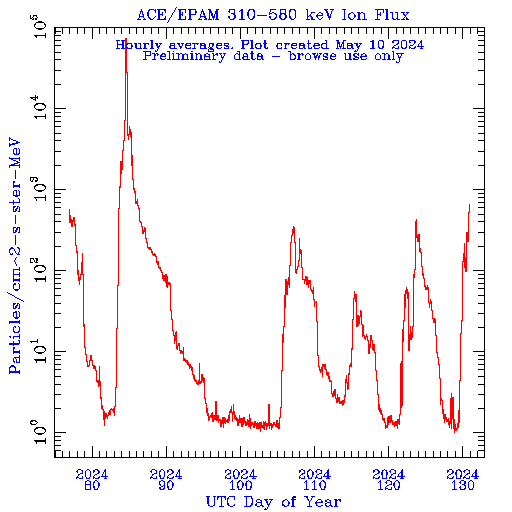
![]() Ion, mid :
1 hr Average
go to daily Avg.
Ion, mid :
1 hr Average
go to daily Avg.
![]()
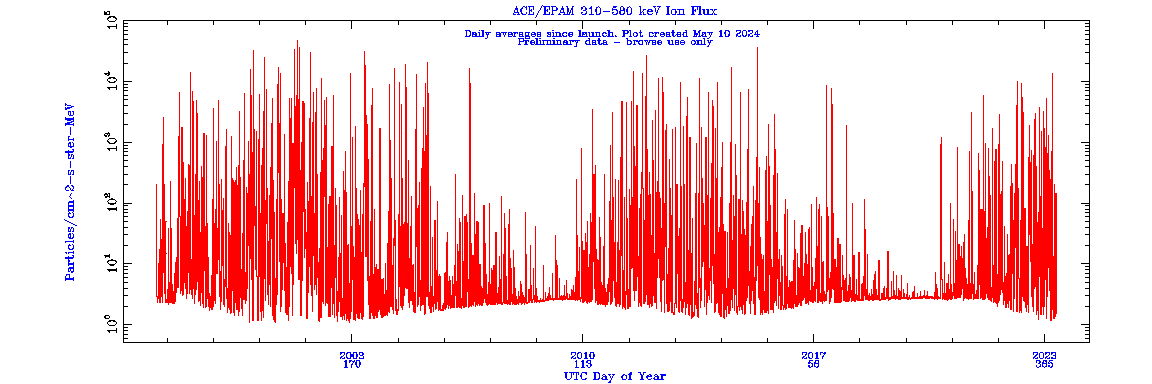
![]() Ion, mid :
daily Average
go to 1 hr Avg.
Ion, mid :
daily Average
go to 1 hr Avg.
![]()
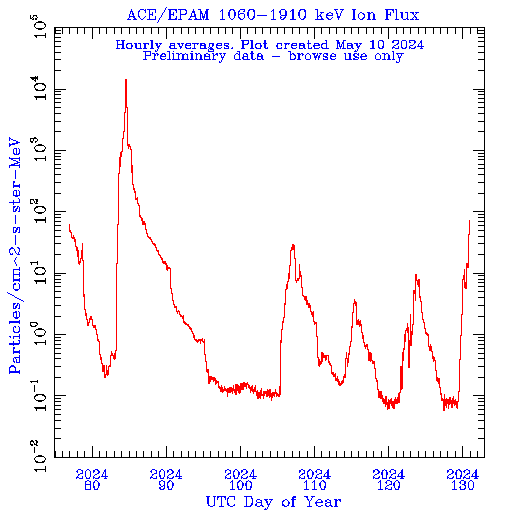
![]() Ion, hi :
1 hr Average
go to daily Avg.
Ion, hi :
1 hr Average
go to daily Avg.
![]()
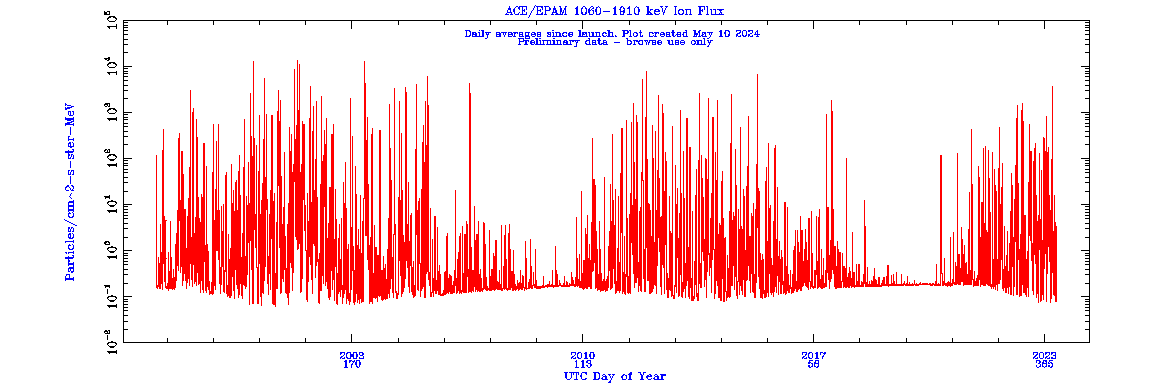
![]() Ion, hi :
daily Average
go to 1 hr Avg.
Ion, hi :
daily Average
go to 1 hr Avg.
![]()
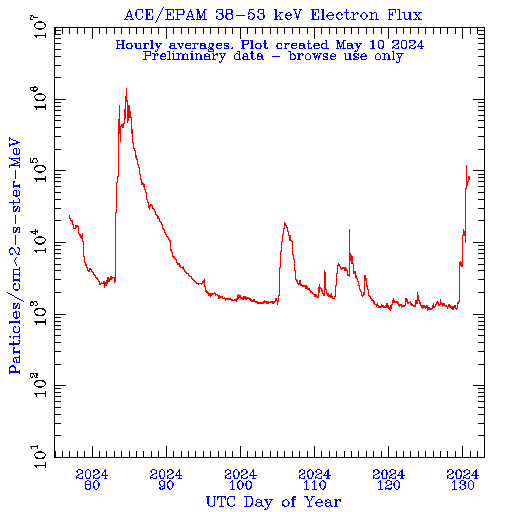
![]() Electron, lo :
1 hr Average
go to daily Avg.
Electron, lo :
1 hr Average
go to daily Avg.
![]()
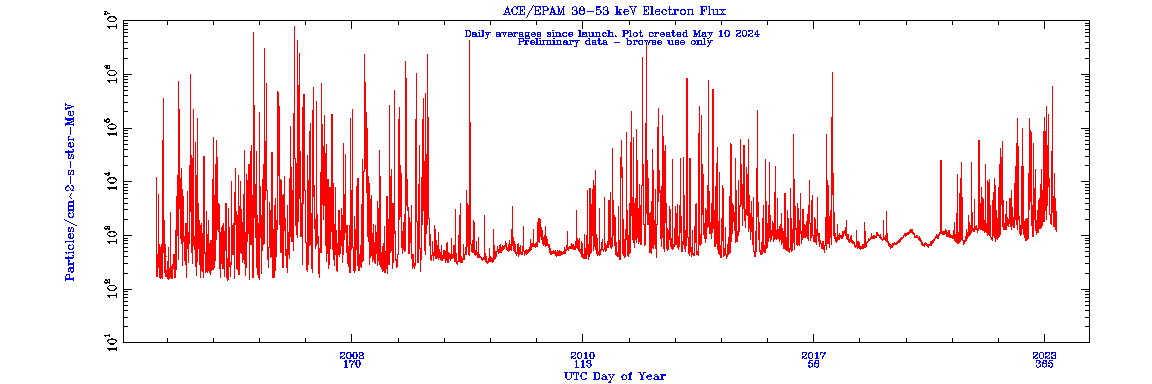
![]() Electron, lo :
daily Average
go to 1 hr Avg.
Electron, lo :
daily Average
go to 1 hr Avg.
![]()
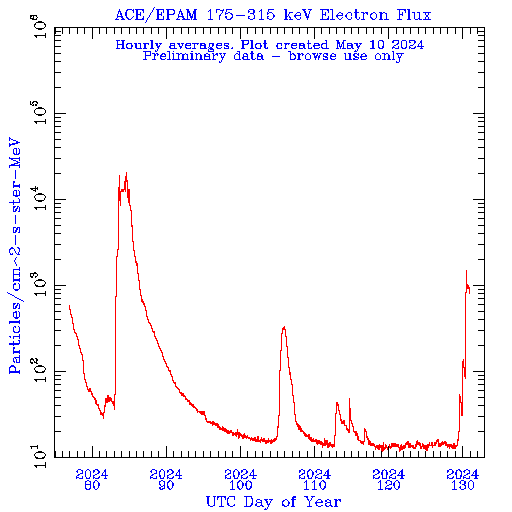
![]() Electron, hi :
1 hr Average
go to daily Avg.
Electron, hi :
1 hr Average
go to daily Avg.
![]()
![]() Electron, hi :
daily Average
go to 1 hr Avg.
Electron, hi :
daily Average
go to 1 hr Avg.
